Over the last couple of weeks a number of posts have popped up in my Social Media timelines with links to maps of Berlin. The maps provide valuable insights into the history and development of the city and/or useful tools for residents and future residents alike.
Interactive Map of Berlin Rents and Affordability
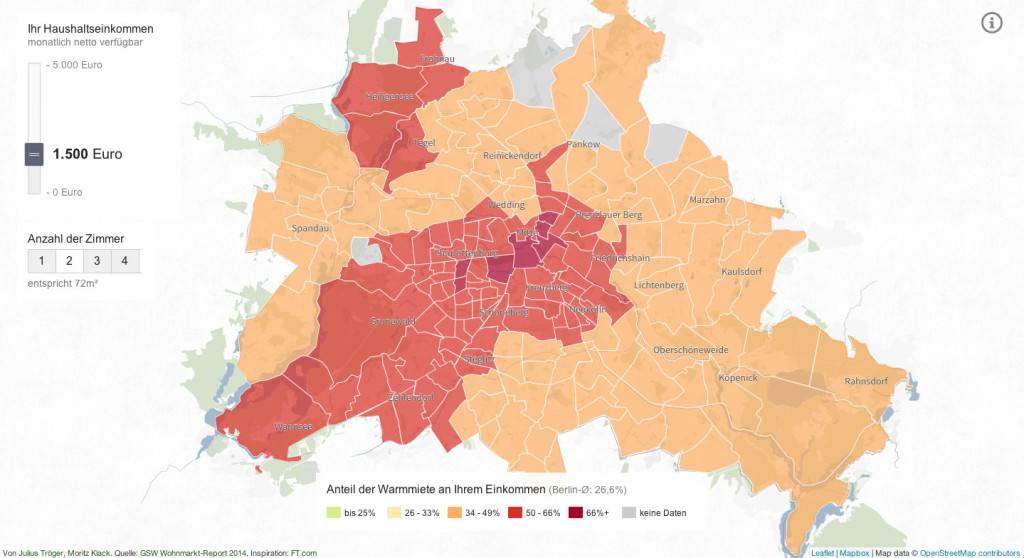
Published by Berliner Morgenpost under the title Neuvermietungen: Wo Sie sich Berlin leisten können, and based on the GSW Wohnmarkt-Report 2014, this interactive map allows you to determine where you can afford to live in Berlin.
The data is based on properties offered for rental in the first three quarters of 2013.
A slider allows you to select a monthly net income for your household and by selecting the number of rooms required (bedrooms +1), the map will display rental data for each of the areas marked on the map.
The map is colour-coded to show the percentage of household income required to rent the given properties (typical area in m2).
There is also a very handy comparison with prices in 2008 for those interested in the development of the property rental market in Berlin.
Berlin Atlas of Crime
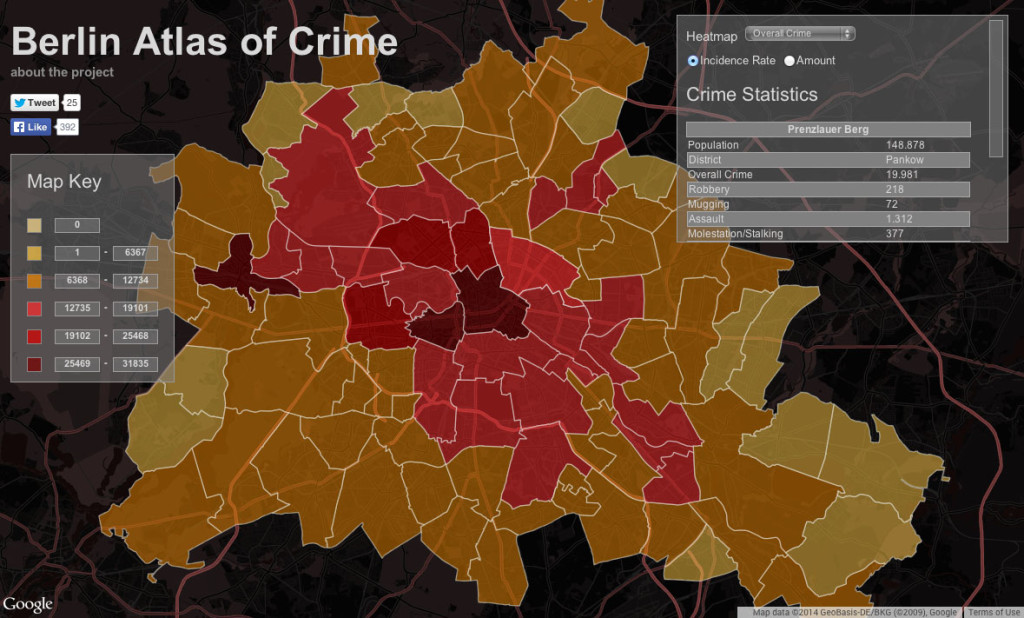
The Berlin Atlas of Crime is an interactive map created by Tobias Burri and Lars Bullmann that visualises criminal activity in Berlin for 2010 and 2011, with data taken from the August 2012 report of the same name, as produced by the police of the Federal State of Berlin.
The dropdown menu allows the user to switch between overall crime statistics or specific categories of crime: Robbery, Mugging, Arson etc. to create a Heatmap. Clicking on each district of the map displays more detailed crime figures.
You can find out more about the data represented in the ‘About the Project’ section of the website.
Click here for the Berlin Atlas of Crime interactive map of crime statistics.
Via Digital Cosmonaut on Twitter.
Interactive Berlin Transport Map
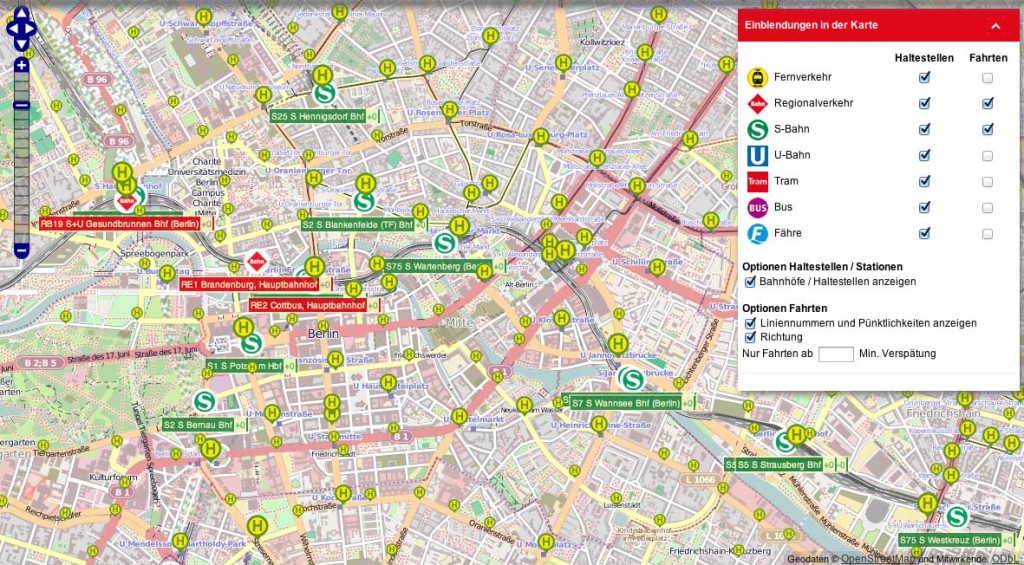
Currently in a test phase on website of VBB (Verkehrsverbund Berlin-Brandenburg), the provider of public transport for Berlin and Brandeburg, the VBB-Livekarte is an interactive travel map.
The user selects the transport options required and the currently active services move along their routes on the map.
Whilst it is still in development (U-Bahn and bus data is not currently available) this is an interesting development and once full, real-time data is available with be an invaluable travel tool for Berlin.
Click here for the VBB-Livekarte interactive map of Berlin public transport.
Via berlinish on Twitter.
Figure-ground Diagram (Schwarzplan) of Berlin (2010)
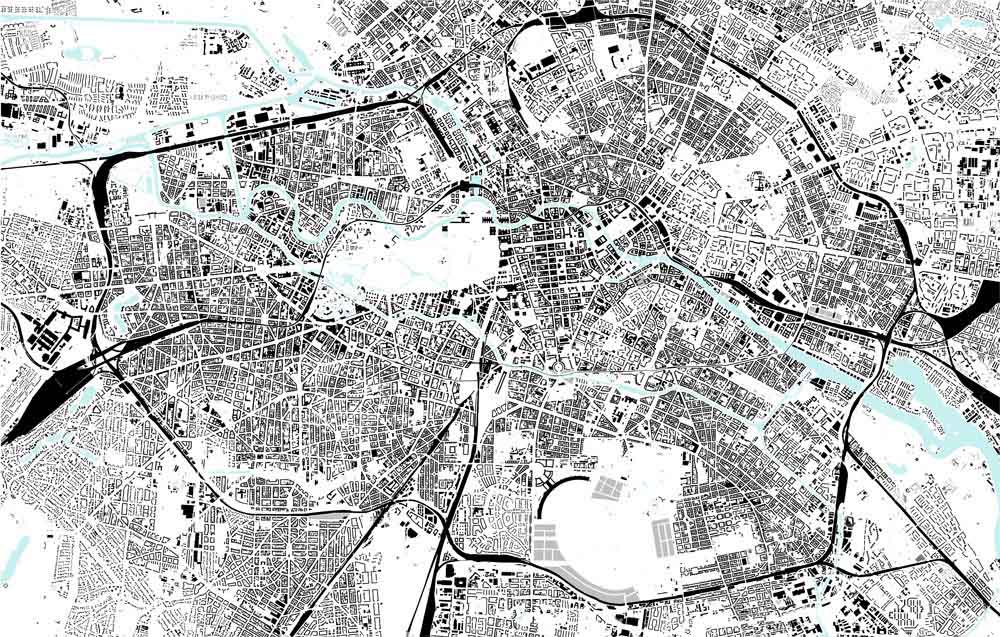
Schwarzplan is the German term for a Figure-ground Diagram, an architectural map, which is described by Gareth Davies on Shlur:
Mostly used by city planners, architects and urban designers, the idea of a figure-ground diagram goes back to 18th Century Rome, when Giambattista Nolli created a detailed map of 12 copper plates using the same basic principle. White symbolises unbuilt space, such as roads, parks and squares, and black indicates built space in terms of the ground-plan of the buildings. The result is something both abstract and filled with detail, a kind of practical Yin and Yang of the city. Figure-ground diagrams help to see the ratio of built space to that of empty space, enabling city planners to envisage areas that are conducive to a good communities, have a human scale and don’t lead to a disconnectedness between buildings and the further urban fabric.
The article on Shlur has further maps of Berlin that show it’s historical development. The comparison of the maps from 1940 and 1953 show the shocking extent of the destruction of Berlin in World War II.
Click here for for the Shlur article: Schwarzplan – Maps in Monochrome.




Interesting in-depth information on a city I like so much. Every visit to great Berlin was more than memorable… and I love to read more about this wonderful place, so I am better informed for my next visit.